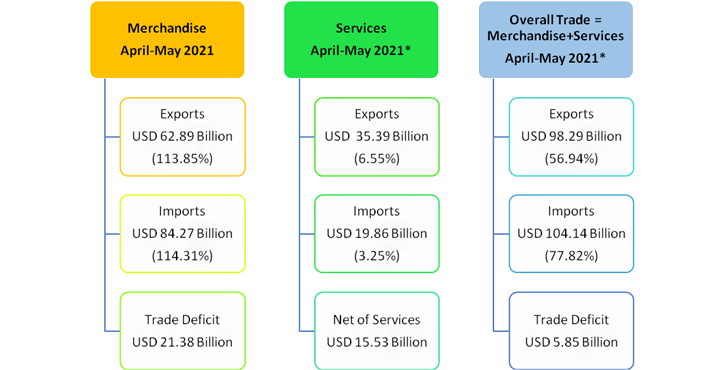
New Delhi: India’s overall exports (Merchandise and Services combined) in April-May2021 are estimated to be USD 98.29Billion, exhibiting a positive growth of 56.94per cent over the same period last year. Overall imports in April-May2021 are estimated to be USD 104.14Billion, exhibiting a positive growth of 77.82per cent over the same period last year.
*Note i) The latest data for the services sector released by RBI is for April 2021. The data for May 2021 is an estimation, which will be revised based on RBI’s subsequent release ii) the figures in the bracket are growth rates vis-à-vis the corresponding period of last year.
I. MERCHANDISE TRADE
EXPORTS (including re-exports)
Exports in May 2021 were USD 32.27 Billion, as compared to USD 19.05 Billion in May 2020, exhibiting a positive growth of 69.35 percent. In Rupee terms, exports were Rs. 2,36,426.16 Crore in May 2021, as compared to Rs. 1,44,166.01 Crore in May 2020, registering a positive growth of 64.00 percent. As compared to May 2019, exports in May 2021 exhibited a positive growth of 8.11 percent in Dollar terms and 13.53 percent in Rupee terms.
The commodities/commodity groups which have recorded positive growth during May 2021 vis-à-vis May 2020 are Other cereals (847.41%), Jute mfg. including floor covering (256.29%), Petroleum products (227.25%), Handicrafts excl. handmade carpet (192.9%), Gems & jewellery (179.13%), Leather & leather products (155.08%), Meat, dairy & poultry products (146.45%), Man-made yarn/fabs./made-ups etc. (146.34%), Cotton yarn/fabs./made-ups, handloom products etc. (137.93%), RMG of all textiles (114.21%), Carpet (107.85%), Electronic goods (90.79%), Ceramic products & glassware (81.57%), Mica, Coal & other ores, minerals including processed minerals (77.07%), Engineering goods (53%), Cereal preparations & miscellaneous processed items (52.92%), Cashew (38.33%), Marine products (33.58%), Iron ore (25.71%), Plastic & Linoleum (20.46%), Organic & inorganic chemicals (20.05%), Tobacco (15.11%), Rice (12.64%), Oil meals (8.29%) and Coffee (1.08%).
The commodities/commodity groups which have recorded negative growth during May 2021 vis-à-vis May 2020 are Fruits & vegetables (-7.1%), Oil seeds (-7.09%), Drugs & pharmaceuticals (-5.36%), Tea (-3.4%) and Spices (-0.33%).
The cumulative value of exports for the period April-May 2021 was USD 62.89 Billion (Rs. 4,64,497.92 Crore) as against USD 29.41 Billion (Rs. 2,23,117.42 Crore) during the period April-May 2020, registering a positive growth of 113.85 percent in Dollar terms (positive growth of 108.19 percent in Rupee terms). As compared to April-May 2019, exports in April-May 2021 exhibited a positive growth of 12.54 percent in Dollar terms and 19.40 percent in Rupee terms.
Non-petroleum and Non-Gems and Jewellery exports in May 2021 were USD 23.97 Billion, as compared to USD 16.36 Billion in May 2020, registering a positive growth of 46.50 percent. As compared to May 2019, Non-petroleum and Non-Gems and Jewellery exports in May 2021registered a positive growth of 11.51 percent. Non-petroleum and Non-Gems and Jewellery exports in April-May 2021 were USD 47.59 Billion, as compared to USD 25.44 Billion for the corresponding period in 2020-21, which is an increase of 87.08 percent. As compared to April-May 2019, Non-petroleum and Non-Gems and Jewellery exports in April-May 2021 registered a positive growth of 15.78 percent.
IMPORTS
Imports in May 2021 were USD 38.55 Billion (Rs. 2,82,453.56 Crore), which is an increase of 73.64 per cent in Dollar terms and 68.15 per cent in Rupee terms over imports of USD 22.20 Billion (Rs 1,67,977.68 Crore) in May 2020. Imports in May 2021 have registered a negative growth of(-) 17.42 per cent in Dollar terms and (-) 13.28 per cent in Rupee terms in comparison to May 2019. Cumulative value of imports for the period April-May 2021 was USD 84.27 Billion (Rs. 6,22,958.62 Crore), as against USD 39.32 Billion (Rs. 2,98,502.76 Crore) during the period April-May 2020, registering a positive growth of 114.31 per cent in Dollar terms and a positive growth of 108.69 per cent in Rupee terms. Imports in April-May 2021 have registered a negative growth of (-) 5.39 per cent in Dollar terms and positive growth of 0.48 per cent in Rupee terms in comparison to April-May 2019.
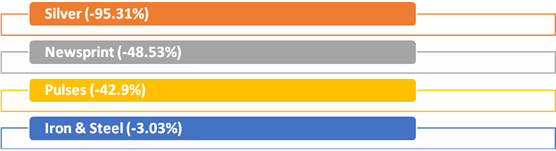
Major commodity groups of import showing negative growth in May2021 over the corresponding month of last year are:
CRUDE OIL AND NON-OIL IMPORTS:
Oil imports in May 2021 were USD 9.45 Billion (Rs. 69,255.28 Crore), which was 171.10 percent higher in Dollar terms (162.52 percent higher in Rupee terms), compared to USD 3.49 Billion (Rs. 26,380.50 Crore) in May 2020. As compared to May 2019, oil imports in May 2021 were 24.94 percent lower in Dollar terms and 21.18 percent lower in Rupee terms. Oil imports in April-May 2021 were USD 20.32 Billion (Rs.1,50,224.04 Crore) which was 149.44 percent higher in Dollar terms (142.62 percent higher in Rupee terms) compared to USD 8.15 Billion (Rs. 61,917.72 Crore), over the same period last year. As compared to April-May 2019, oil imports in April-May 2021 were 15.86 percent lower in Dollar terms and 10.66per cent lower in Rupee terms.
In this connection, it is mentioned that the global Brent price ($/bbl) has increased by 119.34% in May 2021 vis-à-vis May 2020 as per data available from World Bank.
Non-oil imports in May 2021 were estimated at USD 29.10 Billion (Rs. 2,13,198.28 Crore) which was 55.48 percent higher in Dollar terms (50.57 percent higher in Rupee terms), compared to USD 18.71 Billion (Rs. 1,41,597.18 Crore) in May 2020. As compared to May 2019, Non-oil imports in May 2021, were 14.64per cent lower in Dollar terms and 10.37 percent lower in Rupee terms. Non-oil imports in April-May 2021 were USD 63.95 Billion (Rs. 4,72,734.58 Crore) which was 105.13 percent higher in Dollar terms (99.82 percent higher in Rupee terms), compared to USD 31.17 Billion (Rs. 2,36,585.04 Crore) in April-May 2020. As compared to April-May 2019, Non-oil imports in April-May 2021 were 1.49 percent lower in Dollar terms and 4.62 percent higher in Rupee terms.
Non-Oil and Non-Gold imports were USD 28.42Billion in May 2021, recording a positive growth of 52.48per cent, as compared to Non-Oil and Non-Gold imports of USD 18.64Billion in May 2020. Non-Oil and Non-Gold imports in May 2021 recorded negative growth of (-) 3.04 percent over May 2019. Non-Oil and Non-Gold imports were USD 57.03Billion in April-May 2021, recording a positive growth of 83.40per cent, as compared to Non-Oil and Non-Gold imports of USD 31.10Billion in April-May 2020. Non-Oil and Non-Gold imports in April-May 2021 recorded a positive growth of 1.55 percent over April-May 2019.
II. TRADE IN SERVICES
EXPORTS (Receipts)
As per the latest press release by RBI dated 1st June 2021, exports in April 2021 were USD 17.55Billion (Rs.1,30,676.37Crore) registering a positive growth of 6.67per cent in Dollar terms, vis-à-vis April 2020. The estimated value of services export for May 2021 is USD 17.85Billion.
IMPORTS (Payments)
As per the latest press release by RBI dated 1st June 2021, imports in April 2021were USD 9.90Billion (Rs. 73,697.69Crore) registering a positive growth of 6.40per cent in Dollar terms, vis-à-vis April 2020. The estimated value of services import for May2021* is USD 9.97Billion.
MERCHANDISE: The trade deficit for May2021 was estimated at USD6.28Billion as against the deficit of USD3.15Billion inMay2020, which is an increase of 99.61 percent.
SERVICES: As per RBI’s Press Release dated 1st June 2021, the trade balance in Services (i.e. Net Services export) for April 2021is USD7.65Billion. The estimated trade balance in May 2021* is USD 7.88Billion.
OVERALL TRADE BALANCE: Taking merchandise and services together, overall trade deficit for April-May 2021* is estimated at USD5.85Billion as compared to the surplus of USD4.06Billion in April-May 2020.
*Note: The latest data for services sector released by RBI is for April 2021. The data for May2021 is an estimation, which will be revised based on RBI’s subsequent release.