Crude oil production during August 2021 was 2518.56TMT, which is 5.98% lower than the target for the month and 2.29% lower when compared with production of August 2020. Cumulative crude oil production during April-August, 2021 was 12480.21TMT, which is 3.33% and 3.15% lower than the target for the period and production during the corresponding period of last year respectively. Unit-wise and State-wise crude oil production are given in Annexure-I. Unit-wise crude oil production for the month of August 2021 and cumulatively for April-August, 2021 vis-à-vis the same period of last year has been shown in Table-1 and month-wise in Figure-1.
Table-1: Crude Oil Production (in TMT)
| Oil Company | Target | August (Month) | April-August (Cumulative) | ||||||
| 2021-22 (Apr-Mar)* | 2021-22 | 2020-21 | % over last year | 2021-22 | 2020-21 | % over last year | |||
| Target* | Prod.* | Prod. | Target* | Prod.* | Prod. | ||||
| ONGC | 20272.88 | 1753.49 | 1642.76 | 1708.23 | 96.17 | 8439.43 | 8119.84 | 8515.19 | 95.36 |
| OIL | 3182.60 | 262.25 | 253.51 | 242.98 | 104.34 | 1273.45 | 1249.15 | 1239.98 | 100.74 |
| PSC Fields | 7718.52 | 663.07 | 622.29 | 626.32 | 99.36 | 3197.31 | 3111.22 | 3131.26 | 99.36 |
| Total | 31173.99 | 2678.81 | 2518.56 | 2577.52 | 97.71 | 12910.20 | 12480.21 | 12886.43 | 96.85 |
Note: Totals may not tally due to rounding off.*: Provisional
Figure-1: Monthly Crude Oil Production 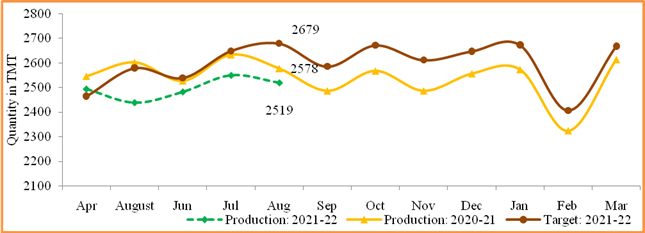
Unit-wise production details with reasons for the shortfall are as under:
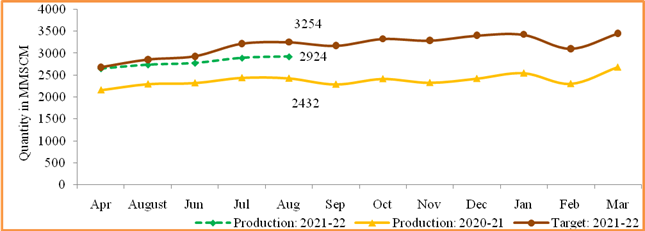
Natural gas production during August 2021 was 2923.94MMSCM, which is 20.23% higher when compared with production of August 2020 but 10.14% lower than the monthly target. Cumulative natural gas production during April-August, 2021 was 13985.76MMSCM, which is 19.94% higher than production during the corresponding period of last year but 6.39% lower when compared with a target for the period. Unit-wise and state-wise natural gas production is given in Annexure-II. Unit-wise natural gas production for the month of August 2021 and cumulatively for the April-August, 2021 vis-à-vis same period of last year has been shown in Table-2 and month-wise in Figure-2.
Table-2: Natural Gas Production (inMMSCM)
| Oil Company | Target | August (Month) | April- August (Cumulative) | ||||||
| 2021-22 (Apr-Mar)* | 2021-22 | 2020-21 | % over last year | 2021-22 | 2020-21 | % over last year | |||
| Target* | Prod.* | Prod. | Target* | Prod.* | Prod. | ||||
| ONGC | 23335.10 | 2002.07 | 1743.54 | 1920.55 | 90.78 | 9595.24 | 8526.13 | 9196.71 | 92.71 |
| OIL | 2949.65 | 251.06 | 256.59 | 188.59 | 136.05 | 1235.25 | 1180.19 | 1041.14 | 113.36 |
| PSC Fields | 11834.60 | 1000.66 | 923.82 | 322.77 | 286.22 | 4110.52 | 4279.45 | 1422.52 | 300.84 |
| Total | 38119.35 | 3253.79 | 2923.94 | 2431.91 | 120.23 | 14941.01 | 13985.76 | 11660.37 | 119.94 |
Note: Totals may not tally due to rounding off. *: Provisional
Figure-2: Monthly Natural Gas Production
Crude Oil Processed during August2021 was 18438.58TMT, which is 14.17% higher than August 2020but 0.33% lower than the target for the month.Cumulative crude throughput during April-August, 2021 was95077.05TMT, which is 15.30% higher when compared with the production of corresponding period of last year but 2.55% lower than target for the period. Refinery-wise details of the crude throughput and capacity utilization during the month of August 2021 vis-à-vis August 2020 are given at Annexure-III and Annexure-IV. Company-wise crude throughput for the month of August2021and cumulatively for April-August, 2021vis-à-vis same period of last year has been shown in Table-3 and month-wise in Figure-3.
Figure 3: Crude Oil Processed (Crude Throughput)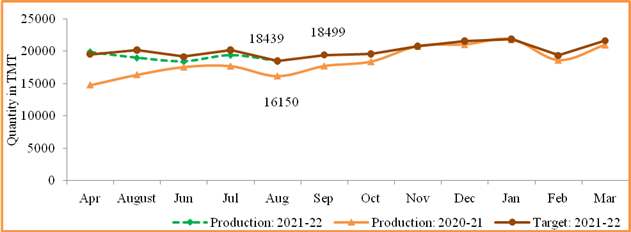
Table 3: Crude Oil Processed (Crude Throughput) (in TMT)
| Oil Company | Target | August (Month) | April- August (Cumulative) | ||||||
| 2021-22 (Apr-Mar)* | 2021-22 | 2020-21 | % over last year | 2021-22 | 2020-21 | % over last year | |||
| Target* | Prod.* | Prod. | Target* | Prod.* | Prod. | ||||
| CPSE | 145812.84 | 11034.69 | 9908.62 | 8722.76 | 113.59 | 58655.33 | 52576.80 | 44900.15 | 117.10 |
| IOCL | 70299.81 | 4962.97 | 4903.56 | 3949.64 | 124.15 | 29097.16 | 27290.18 | 22242.55 | 122.69 |
| BPCL | 30499.94 | 2620.00 | 2373.02 | 1763.37 | 134.57 | 13205.00 | 11429.23 | 8774.42 | 130.26 |
| HPCL | 17199.69 | 1426.02 | 777.98 | 1309.71 | 59.40 | 6030.34 | 4085.63 | 6634.77 | 61.58 |
| CPCL | 10000.00 | 780.00 | 629.07 | 561.68 | 112.00 | 3640.00 | 3482.14 | 2613.44 | 133.24 |
| NRL | 2750.35 | 240.17 | 211.69 | 225.72 | 93.78 | 1107.89 | 1078.61 | 1070.24 | 100.78 |
| MRPL | 15000.00 | 1000.00 | 1006.57 | 905.22 | 111.20 | 5550.00 | 5181.67 | 3534.42 | 146.61 |
| ONGC | 63.04 | 5.53 | 6.74 | 7.43 | 90.78 | 24.94 | 29.35 | 30.32 | 96.81 |
| JVs | 18021.00 | 1536.00 | 1709.93 | 1498.34 | 114.12 | 7490.00 | 8246.34 | 6135.51 | 134.40 |
| BORL | 7000.00 | 600.00 | 598.10 | 450.87 | 132.65 | 2870.00 | 2812.12 | 2021.89 | 139.08 |
| HMEL | 11021.00 | 936.00 | 1111.83 | 1047.47 | 106.14 | 4620.00 | 5434.22 | 4113.62 | 132.10 |
| Private | 78008.07 | 5928.57 | 6820.02 | 5928.57 | 115.04 | 31423.55 | 34253.91 | 31423.56 | 109.01 |
| RIL | 60940.96 | 4389.74 | 5109.62 | 4389.74 | 116.40 | 23967.89 | 25891.76 | 23967.89 | 108.03 |
| NEL | 17067.11 | 1538.83 | 1710.41 | 1538.83 | 111.15 | 7455.67 | 8362.15 | 7455.67 | 112.16 |
| TOTAL | 241841.91 | 18499.26 | 18438.58 | 16149.67 | 114.17 | 97568.88 | 95077.05 | 82459.22 | 115.30 |
Note: Totals may not tally due to rounding off.*: Provisional
3.1 CPSE Refineries’ crude oil processed is higher than actual production in a corresponding month and period of last year i.e. Aug’20 (13.59%) & Apr-Aug’20 (17.10%). However, it is less than the monthly target of Aug’21 (10.2%) as well as the April – Aug’21 target (10.36%). Reasons for shortfall in production as compared to target are as under:
3.2 JV refineries’ crude oil processed higher than the monthly target of Aug’21 (11.32%) as well as the April – Aug’21 target (10.1%). Also, it is higher than actual production in the corresponding month and period of last year i.e. Aug’20 (14.12%) & Apr-Aug’20 (34.4%).
3.3 Private refineries’ crude oil processed higher than actual production in corresponding month and period of last year i.e. Aug’20 (15.04%) & Apr-Aug’20 (9.01%).
Production of Petroleum Products during August 2021 was 19560.19 TMT, which is 9.05% higher than the production of August 2020 but 2.72% lower when compared with a target for the month. Cumulative production during April-August, 2021 was 100237.95TMT, which is 12.26% higher when compared with the production of the corresponding period of last year but 3.25% lower than the target for the period. Unit-wise production of petroleum products is given in Annexure-V. Company-wise production for the month of August 2021and cumulatively for April-August, 2021 vis-à-vis the same period of last year has been shown in Table-4 and month-wise in Figure-4.
Table 4: Production of Petroleum Products (TMT)
| Oil Company | Target | August (Month) | April- August (Cumulative) | ||||||
| 2021-22 (Apr-Mar)* | 2021-22 | 2020-21 | % over last year | 2021-22 | 2020-21 | % over last year | |||
| Target* | Prod.* | Prod. | Target* | Prod.* | Prod. | ||||
| CPSE | 137873.44 | 10447.41 | 9650.59 | 8356.41 | 115.49 | 55522.01 | 49993.81 | 42542.18 | 117.52 |
| IOCL | 66984.33 | 4740.85 | 4832.05 | 3811.73 | 126.77 | 27776.41 | 26125.73 | 21230.02 | 123.06 |
| BPCL | 29279.04 | 2514.21 | 2309.51 | 1705.24 | 135.44 | 12645.65 | 11120.41 | 8434.52 | 131.84 |
| HPCL | 16019.55 | 1332.71 | 691.69 | 1319.97 | 52.40 | 5620.10 | 3850.15 | 6319.91 | 60.92 |
| CPCL | 9279.11 | 721.72 | 607.20 | 486.72 | 124.76 | 3364.68 | 3172.50 | 2362.23 | 134.30 |
| NRL | 2749.06 | 240.06 | 207.85 | 227.83 | 91.23 | 1107.37 | 1043.35 | 1075.74 | 96.99 |
| MRPL | 13502.33 | 892.58 | 995.82 | 797.80 | 124.82 | 4984.07 | 4653.66 | 3090.84 | 150.56 |
| ONGC | 60.02 | 5.27 | 6.47 | 7.13 | 90.74 | 23.74 | 28.02 | 28.93 | 96.86 |
| JVs | 16361.00 | 1410.00 | 1604.49 | 1354.88 | 118.42 | 6868.00 | 7647.47 | 5684.08 | 134.54 |
| BORL | 6095.00 | 523.00 | 554.54 | 363.62 | 152.51 | 2493.00 | 2498.72 | 1710.19 | 146.11 |
| HMEL | 10266.00 | 887.00 | 1049.94 | 991.26 | 105.92 | 4375.00 | 5148.75 | 3973.89 | 129.56 |
| Private | 93222.97 | 7843.65 | 7970.12 | 7843.65 | 101.61 | 39311.32 | 40879.68 | 39311.32 | 103.99 |
| RIL | 76683.16 | 6361.44 | 6285.64 | 6361.44 | 98.81 | 32056.96 | 32772.92 | 32056.96 | 102.23 |
| NEL | 16539.81 | 1482.21 | 1684.48 | 1482.21 | 113.65 | 7254.36 | 8106.76 | 7254.36 | 111.75 |
| Total Refinery | 247457.41 | 19701.06 | 19225.19 | 17554.94 | 109.51 | 101701.34 | 98520.96 | 87537.59 | 112.55 |
| Fractionators | 4516.39 | 406.30 | 335.00 | 381.89 | 87.72 | 1902.44 | 1716.99 | 1750.11 | 98.11 |
| TOTAL | 251973.80 | 20107.36 | 19560.19 | 17936.83 | 109.05 | 103603.77 | 100237.95 | 89287.69 | 112.26 |
Note: Totals may not tally due to rounding off. *: Provisional
Figure 4: Monthly Refinery Production of Petroleum Products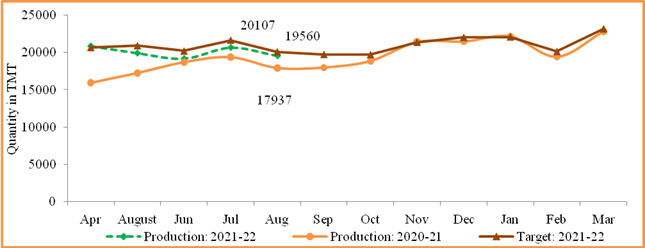
FIRST Business Portal addressing the potential of business capability of North East Region.